![]()
![]()
![]()
5.1 Analysis of survey respondents
5.2 Formation and aims of groups
5.3 Socio-economic status of target communities
5.4 Sharing of Information
5.5 Access to sources of information
The postal survey sought to establish a broad base of facts about groups and organisations known to share information at grassroots level and to determine areas of interest upon which to base more in-depth research. The overall response rate to the postal survey was 49%; a total of 414 forms were sent out, 203 responses were received of which 6 were invalid.4 Survey responses were returned from 49 countries (they were sent to 61 countries). Appendix C shows the national distribution of survey responses.
4 Invalid responses included one group saying their work had changed, one respondent had retired, one form was incomplete, two groups were no longer known at that address, one letter of apology believing it was too late to return the form.
Encouragingly, several organisations commented that they had not only enjoyed completing the questionnaire but that it had helped them reconsider their mode of operation. One even said that filling in the survey form had helped them rethink their priorities in producing materials.
The introductory letter requested that several people should complete the survey together whenever possible. Responses indicated a high level of organisational coherence with 75% of respondents completing the form with two or more respondents. A total of 530 people participated in responding to the survey questions.5
5 15% of groups had some male expatriate involvement (14% with one and 1% with two). 18% had some female expatriate involvement (16% with one and 2% with two females). 2% had one female and one male expatriate.
5.1.1 Nature of organisation or group
In examining the nature of the organisation or group, questions were asked about the origin, size, financial status and the facilities available.
The majority of respondents (67%) worked in a larger organisation, 13% indicated they worked in an informal group, and 10% worked in a small group with less than 5 members. 2% of those who responded indicated that they worked on their own, though the survey had gone only to addresses indicating a group or organisation. NGOs comprised over half the respondents, of whom 29% indicated they had a religious basis. A further 8% were working with denominational religious groups (eg: at parish, circuit or diocesan level). The high percentage of religious based respondents reflects the Christian basis of Footsteps. Government departments or organisations comprised 10% of the respondents, with a further 7% involved in training (including training institutes, universities and colleges) or research. 5% of respondents were involved with literacy or radio broadcasting.
Information regarding the financial position of the group revealed a considerable discrepancy as many groups ignored salaries and operating costs in their budget estimations. Most just indicated the amount available for carrying out their activities, thereby invalidating this data. It is of interest to note that 24% of groups indicated they had either no income or less than US $50 a year and a further 18% had less than US $1,500 a year.
A more accurate picture of the grouping's financial status perhaps comes from the description of their office facilities. 20% of groups had no office facilities of their own at all, while 21% had very limited facilities, lacking a typewriter or computer. 42% of respondents thus had little or no income and, correspondingly, 41% had either no facilities or very limited facilities.
Cross-tabulations examining the relationship between the working situation of the groups and their facilities revealed a highly significant relationship. Few informal groupings had good facilities, a third of religious and church groups had very limited facilities, with a half of NGOs lacking facilities. Government and teaching establishments were considerably better equipped. A statistically significant linear relationship existed between income and available facilities.
Cross-tabulations were also carried out to investigate any relationship between regions of the world and the income of the associations. The majority of respondents with limited office facilities were found within Africa, whereas Asian respondents, in comparison, were significantly better equipped.
5.1.2 Basis for categorisation
Responses to the above questions were used to categorise organisations and groups as detailed in Section 2.3 (page 4).
TABLE 1 - Formation of group in postal survey
|
GROUP FORMED THROUGH... |
|
|
|
an individual's enthusiasm |
45 |
(23%) |
|
community awareness of needs |
40 |
(21%) |
|
support of local government |
22 |
(11%) |
|
work of an outside agency |
14 |
(7%) |
|
co-operative or credit scheme |
2 |
(1%) |
|
other |
9 |
(5%) |
|
Total |
194 |
(100%) |
Missing data 3 cases
The categories were based upon information concerning the nature of the group, their access to facilities and, sometimes, reference to group income for postal survey respondents. The three clear divisions made were refined during in-depth research in Uganda and Ghana where correlations concerning geographical location and objectives were further examined. The frequencies for postal survey respondents were as follows:
Category A
Large NGOs and Government (GOs and NGOs)
|
114 |
58% |
Category B
Grassroots Development Organisations (GDOs)
|
61 |
31% |
Category C
Rural People's Associations (RPAs)
|
22 |
11% |
Respondents therefore included larger, well resourced organisations more usually associated with the provision of information, particularly in printed form, and also respondents from either small, informal, poorly resourced groupings or small organisations with either no income or very low income, not normally considered likely sources for the provision of information. Unless otherwise indicated, results will be given for all respondents but, where relevant, data will be analysed with reference to these categories.
When questioned about the formation of their organisation or group, nearly a quarter of respondents stated that it had begun through the enthusiasm of one individual. (Table 1)
The number of organisations with a religious basis was considerably higher in Africa, accounting for 40% of respondents, compared with 21% in Asia. In Asia the role of individuals was significantly more important, with 33% of respondents selecting this compared with 16% in Africa (p<0.007).
Respondents were asked to indicate their three main aims in order of priority. Two major aims of groups were concerned with improving the situation within their target communities, by improving economic well-being (stated by 60%), and health (54%). Passing on information to the target communities was seen as the third most important aim (47%), with building up the knowledge of group members (30%) in fourth position. Aims which required either a high level of organisation or empowerment such as marketing produce co-operatively, gaining credit and seeking justice received a surprisingly low ranking.
A number of questions sought to establish the nature of the target communities with whom the groups worked. The target communities were predominantly rural (73%). A further 20% of groups worked with both rural and urban communities; only 7% worked solely with urban communities.
Target communities were characterised by high levels of poverty and insecurity, with the majority having no regular income (52%) and few farmers (14%) owning two or more hectares of land. On cross-tabulation, more farmers owning their own land were found in Africa, with more landless labourers in Asia.
Less than a quarter of the target communities were well provided with good quality, inexpensive and accessible health care facilities. The use of traditional healers as commonplace was mentioned by 15% of respondents.
5.3.1 Limiting factors for farmers
Findings from the survey indicate that the overriding limiting factor for agriculture in the target communities was a lack of resources to enable farmers to purchase necessary inputs. Five other limitations received high rankings. Of these key limiting factors, only two - unreliable climate and poor soil fertility - could be attributed mainly to natural causes. A further two - land shortages and poor markets - were likely to require political or economic intervention before significant improvements could be made. Poor access to relevant agricultural information and training was ranked third. Given that this is the one factor out of these six which could be most significantly improved through cost-effective and replicable measures, this provides an indication of the potential significance of this research.
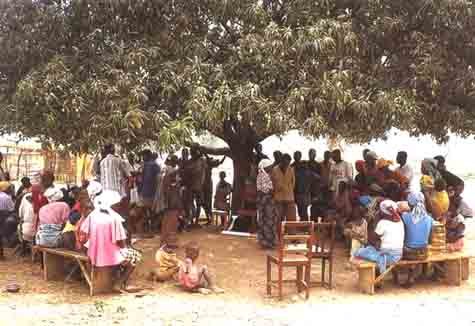
Zangbogu group meeting, Ghana.
This section examines how groups passed on information, their motivation for sharing information, the methods used, the languages used and the kind of people involved in sharing information.
5.4.1 Methods used to pass on information
Few organisations used only one method to pass on information to their target community. The majority used a number of information sharing methods. (Table 2)
Half of the groups and organisations indicated they had been trained, not necessarily through outside workshops or more formal training, but commonly through in-staff training.
The majority (97%) shared information in local languages, some also sharing information in both national and local languages. Small, informal group training was the most commonly used method (72%). Over half used posters, charts and drama or role plays which indicates a willingness to use audiovisual and participatory methods of sharing information. The use of puppets and flannelgraphs by respondents was not widespread, particularly in Africa.
TABLE 2 - Methods employed by postal survey respondents to share information with target community
|
|
FREQUENCY-USING LOCAL LANGUAGE |
FREQUENCY-USING NATIONAL LANGUAGE |
OVERALL PERCENTAGE USING METHOD |
|
Small group teaching |
131 |
10 |
72% |
|
Drama and role plays |
99 |
5 |
53% |
|
Teaching notes |
78 |
23 |
51% |
|
Posters or charts |
78 |
18 |
49% |
|
Production of booklets |
55 |
8 |
32% |
|
Production of literacy materials |
45 |
8 |
27% |
|
Newsletter production |
31 |
10 |
21% |
|
Radio programmes |
23 |
6 |
15% |
|
Use of puppets |
18 |
1 |
10% |
|
Use of flannelgraphs |
17 |
2 |
10% |
Out of a total of 197 groups
Over half (51%) produced teaching notes of some kind, though sometimes these may be material prepared by a head office, since nearly 12% were not in the local language (comparing with an average of 3% for all other methods). The number of organisations using local radio to pass on information indicated a large potential target audience for information. Nearly a third produced booklets and a fifth produced newsletters. Also of interest was that a quarter either specifically produced literacy materials, or indicated that their materials might be suitable for use with literacy training. Since post-literacy materials are often in very short supply, this indicates that 'real' materials may provide useful sources for literacy work.
Over half (54%) of the postal survey respondents used just one local language to share information. Over a quarter (27%) used two languages, one used 12 tribal languages and another 13 tribal languages. A total of 154 different named languages (not all languages used were named), were being used by 197 groups to pass on information to target communities. The majority of these (57%) were African languages, with 33 groups using KiSwahili. For a full list of the languages see Appendix D.
5.4.2 Identification of information needs
Respondents identified the information needs of their target groups by a number of different means. Recent developments in the use of participatory techniques which encourage communities to prioritise their own needs, may have been incorporated into the work of some respondents. Over 40% of groups mentioned community participation in the identification of information needs. In just over a quarter of situations 'outsiders' appeared to play a major role in determining information priorities and needs for the local community. (Table 3)
TABLE 3 - Identification of information needs of target communities by postal survey respondents
|
|
AGREEING | |
|
Community identifies needs together |
49 |
(27%) |
|
We prioritise the needs of the community |
31 |
(17%) |
|
Our experience elsewhere helps us to identify needs |
16 |
(9%) |
|
Community leaders identify needs |
15 |
(8%) |
|
Outside experts help us to identify priorities |
6 |
(3%) |
|
Key individuals in the community identify needs |
5 |
(3%) |
|
Several of the above |
61 |
(33%) |
|
Total |
183 |
(100%) |
Missing data 14 cases
5.4.3 Motivation
The difference between simply having access to useful and relevant information, and the desire to pass it on to others who might find it of use, is considerable. An examination of what motivates people to take this step is of great interest. Are people motivated, for example, by a sense of pride in their own knowledge, by the 'ignorance' of those they wish to help, by religious commitment or by a sense of injustice? Or are the needs of the community in requesting information, driving the process? (Table 4)
Motivation of survey respondents in sharing information
|
|
AGREEING | |
|
People have so little information |
75 |
(39%) |
|
Community requests this information |
67 |
(35%) |
|
To pass on useful source materials in local language |
61 |
(32%) |
|
Group members want to share their skills |
57 |
(30%) |
|
Our head office directs us to share information |
19 |
(10%) |
|
Various other reasons6 |
17 |
(9%) |
Missing data 4 cases6 Among the other reasons given were: helping people make informed decisions (6), developing better community health care (3), Christian evangelism, creating environmental awareness (2), sharing skills with refugees in preparation for resettlement, helping develop a positive outlook on life and finding the most appropriate solution to rural poverty.
Few groups (7%) appeared to be motivated by their organisation's policy directing them to pass on information. This indicated a considerable degree of self direction and confidence among survey respondents. The results suggested that sharing information is not strongly driven by demand for useful information by target communities. Rather, the desire to share information was largely driven by altruistic reasons for nearly half the respondents, and by their awareness of the needs of the target community both for more information, and for more accessible information. A fifth stated that group members wanted to pass on and share their own acquired skills, implying their confidence and pride in the knowledge they have gained.
5.4.4 Education and literacy levels of members
Given that a certain amount of confidence in one's own knowledge is required before sharing information with others, a number of questions were asked to determine the educational background of those involved in training of some sort. No differentiation between formal and informal training was made. (Table 5)
TABLE 5 - Cross-tabulation between categories of postal survey respondents and mean percentage levels of education among staff or group members
|
LEVEL OF EDUCATION |
GOs and NGOs |
GDOs |
RPAs |
|||
|
MALE |
FEMALE |
MALE |
FEMALE |
MALE |
FEMALE |
|
|
Primary schooling |
86% |
83% |
83% |
85% |
76% |
60% |
|
High school - 2 years at least |
78% |
74% |
57% |
53% |
51% |
44% |
|
College |
36% |
31% |
31% |
27% |
25% |
14% |
|
Degree |
37% |
28% |
16% |
12% |
21% |
5% |
|
Literate in English |
72% |
68% |
77% |
71% |
66% |
56% |
|
Literate in local language |
80% |
78% |
87% |
83% |
73% |
66% |
Education or literacy levels for women were consistently lower than for men, the one exception being that of primary schooling in GDOs. In nearly all cases education and literacy levels corresponded to income levels of groups, higher for GO and NGOs and lowest for RPAs. However, literacy levels in local language were higher in GDOs and a surprising number of men held degrees in RPAs.
The sources of information fell into two main divisions. Those of major importance were books and information owned by the group, workshops and training sessions attended and local individuals whose knowledge was respected (this included both 'outside experts' and 'indigenous knowledge experts'). (Table 6)
Table 6 - Information sources of postal survey respondents
|
|
GOs and NGOs |
GDOs |
RPAs |
TOTAL |
|
Newsletters and books |
42% |
38% |
48% |
41% |
|
Local individuals |
11% |
19% |
8% |
13% |
|
Government resource person |
9% |
13% |
14% |
11% |
|
NGO within country |
8% |
9% |
12% |
9% |
|
Workshop or training |
7% |
5% |
7% |
6% |
|
Experts |
5% |
3% |
4% |
4% |
|
Radio or newspaper |
3% |
4% |
1% |
3% |
|
Research station |
4% |
1% |
0% |
3% |
|
Library or resource centre |
2% |
3% |
0% |
2% |
|
Knowledge within community |
3% |
1% |
0% |
2% |
|
Networking |
3% |
0% |
1% |
2% |
|
Religious leaders |
1% |
1% |
4% |
2% |
|
Contact organisation overseas |
2% |
1% |
0% |
1% |
|
Other sources7 |
0% |
2% |
0% |
1% |
|
Total |
100% |
100% |
100% |
100% |
7 Other named sources with a ranking of less than 20 included: information from commercial companies, group meetings, the Bible, experience, travel, tours, information from head offices and distance education.
Sources of significant but lesser importance included government resource personnel, contact through letters or visits to organisations both within country and overseas and use of a nearby library or resource centre. Interestingly, minor and little used sources included the ordering of relevant books which in well resourced countries would be expected to come near the top of the list. In addition the use of libraries and resource centres received a very low ranking. However, their seeming irrelevance may rather have reflected their lack of availability (Menou, 1991; de Horowitz, 1993; Mzeyimana-Kerpen.1993).
Surprisingly, printed information owned by the groups varied little between the three categories and was almost as important for small informal groups as for large, well funded groupings. However, RPAs had virtually no access to resource centres or the opportunity of purchasing books. Access to training workshops was higher for GOs and NGOs, presumably since they were more likely to be informed of the availability of such courses and secondly, were more likely to have the resources to enable staff to attend. Government resource people such as extension agents and local knowledgeable individuals were of considerably more importance to RPAs and GDOs than for larger GOs and NGOs. All categories of groups indicated that they made good use of letters to organisations. GOs and NGOs had much better access to resource centres and were more likely to be able to purchase necessary books. They also tended to be less dependent on government resource people and other organisations. The overall ranking places books and other printed information in priority of place in terms of information sources used, for all three categories of groups. This was a finding of some significance for this research.
Four out of the five most important sources were exogenous to the respondents and, given that individuals with expertise might be both exogenous or indigenous to groups, this figure is may be slightly higher. Outside information was thus seen as highly significant and valued by all categories of groups. These results gave no indication of the value attached to indigenous knowledge from outside the
Missing data 6 cases local community which may be shared either by development workers or local newsletters and the comparable value attached to what could be termed 'scientific' information from outside sources. This was an area which needed to be further investigated during the in-depth research.
5.5.1 Satisfaction with information access
Given the focus of the research on printed information, postal survey respondents were asked to assess the availability of reading materials within their target communities. (Table 7)
Some interesting observations emerged here. Firstly only a tiny minority of respondents (3%) saw their target communities as having good access to reading materials. Nearly half (41%) lacked good access to reading materials of any kind. Nearly a quarter believed their access was restricted either through lack of purchasing power or the lack of material in local languages. Nearly a third were believed to have no interest in reading materials because they were not literate. It is worth noting that these were the perceptions of the organisations providing information; not of the target communities themselves and these perceptions needed further investigation during Phase II. These figures, admittedly from a sample group, nevertheless may serve to indicate the extent of the famine of printed information in many developing countries and to highlight the difficulty people have in maintaining literacy when there is so little to read.
TABLE 7 - Reading materials available to target community from postal survey
|
Good access to reading materials |
6 |
(3%) |
|
Good supply available but few have funds to purchase |
20 |
(11%) |
|
Good supply of English material but little in local language |
20 |
(11%) |
|
Few are literate so little interest in reading |
58 |
(31%) |
|
Few reading materials of any kind available |
75 |
(41%) |
|
Other comments8 |
6 |
(3%) |
|
Total |
185 |
(100%) |
Missing data 12 cases8 Other comments included: no materials on the subject of development, an increasing interest in vernacular languages and unawareness of how to order materials.
5.5.2 Information access of respondents
(Table 8) A quarter of respondents (25%) were satisfied with the information they recently obtained on a specific topic. Those who lacked access to useful contacts were very few, maybe revealing that everyone knows somewhere to turn to for advice but would often like more contacts. 14% lacked funds to purchase relevant books and information, a figure that was significantly higher for GDOs and RPAs. Overall, 75% were dissatisfied with their information sources for one reason or another.
TABLE 8 - Satisfaction towards information access of postal survey respondents
|
Obtained some information but not enough |
74 |
(42%) |
|
Found enough useful information |
45 |
(25%) |
|
Lacked funds to purchase useful information |
24 |
(14%) |
|
Information obtained was not relevant |
11 |
(6%) |
|
Lacked contacts to find useful sources |
6 |
(3%) |
|
Several of above |
17 |
(10%) |
|
Total |
177 |
(100%) |
Missing data 20 cases
When cross-tabulated with income and region, there were no significant relationships apparent -revealing that perceptions of information access were not always linked with income or geographical location. When the three categories were looked at individually, surprisingly, it was the RPAs who seemed most content with their access to outside information; possibly a reflection that their horizons were limited by the available sources in their immediate area?
5.5.3 Presentation of information
(Table 9) Part of the postal survey sought to probe respondents' attitudes towards the manner in which information was presented. The majority of respondents found access to outside information a problem, with two thirds unable to obtain information in the local language and just over a third finding information too expensive or lacking good contacts. Just under a third (27%) found the available information difficult to understand. Only a quarter (24%) were relatively well-resourced with adequate access to information and often without enough time to read all available information. Only 15% of groups had funding to enable them to purchase necessary books.
TABLE 9 - Attitudes to presentation of information of postal survey respondents
|
|
GOs & NGOs AGREEING |
GDOs AGREEING |
RPAs AGREEING |
TOTAL AGREEING |
|
Information available but not in local language |
61% |
63% |
63% |
62% |
|
Information available but too expensive |
36% |
47% |
53% |
41% |
|
Hard to find information and contacts |
36% |
46% |
58% |
41% |
|
Information available but difficult to understand |
23% |
31% |
42% |
27% |
|
Access to information but little time to read |
33% |
10% |
16% |
24% |
|
Funding available to order necessary books |
18% |
17% |
5% |
16% |
|
Information is not a problem |
15% |
15% |
11% |
15% |
Missing data 8 cases. 7% added additional comments.99 Information available is often not very appropriate (3), few people read so little is available (2), information is often out of date (2), information is available but too expensive to copy (1), would like to develop resource centre (1), need access to computer technology (1) and people have no tradition of researching information (1).
When the three categories are compared, all RPAs lacked funding to purchase books and found material more difficult to understand. They also found it hardest to find good contacts. Staff in GOs and NGOs were better able to make good contacts, though they had considerably less time to read available materials.
When cross-tabulated with the number of expatriate staff, some significant differences did emerge. For example, very few groups (5%) with expatriate workers agreed that information was either too expensive or difficult to understand.
5.5.4 Newsletters
Newsletters, both national and international, are one source of outside information which is often available free of charge, irrespective of geographical location. Access to Footsteps newsletter was a common factor amongst all respondents. The role of newsletters proved a significant one in providing information. (Table 10)
TABLE 10 - Access to newsletters by postal survey respondents
|
None |
3 |
(2%) |
|
Between 1 and 3 received |
71 |
(37%) |
|
Over 3 newsletters received |
106 |
(56%) |
|
Too many - no time to read them |
10 |
(5%) |
|
Total |
190 |
(100%) |
Missing data 7 cases
These results are interesting when compared with the average information overload common in industrial countries (Hamelink, 1995; UNDP, 1998). Of the 5% who reported they lacked time to read the newsletters they received, nearly all were in high income groups. The distribution of newsletters was similar for all three categories.
Readers were asked to name the two most useful newsletters they received. A total of 81 individual newsletters were named - the majority of which were only mentioned by one reader - and they included 31 newsletters in local languages. Not surprisingly perhaps, as it was the one they all had in common and because this might be an area where respondents were trying to include the 'right' answer, 123 listed Footsteps as one of the most useful. Table 11 indicates those newsletters mentioned by 5 or more respondents.
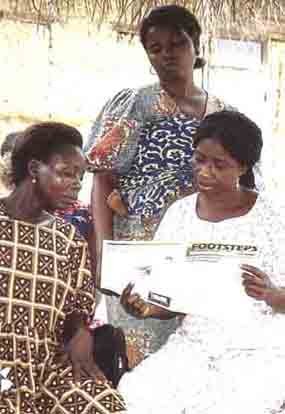
Newsletters were a valued and regular source of new information.
TABLE 11 - Newsletters found most useful by respondents of the postal survey
|
|
FREQUENCY |
|
Footsteps |
123 |
|
lleia |
16 |
|
Child Health |
15 |
|
Spore |
13 |
|
ECHO Development Notes |
9 |
|
Contact |
8 |
|
Heifer International |
7 |
|
AIDS Action |
6 |
|
Together |
5 |
|
Total of remaining 72 newsletters |
96 |
|
Total |
298 |
Respondents could mention two newsletters
Newsletters were grouped together under the categories and sources shown in Table 12. This serves to illustrate the considerable range of available newsletters. A third of newsletters were from local or regional sources within developing countries, the remaining two-thirds from industrial country sources. All newsletters listed that were familiar to the researcher, were known to be available free of charge to those working in developing countries. Given that newsletters were among the first sources of information listed as most useful and that so many were freely available, it was apparent that they were an extremely valuable and regular source of new information.
TABLE 12 - Categories of newsletters received by postal survey respondents
|
Local language newsletters |
31% |
|
Health newsletters |
15% |
|
Literacy, development and education newsletters |
16% |
|
Agricultural newsletters |
14% |
|
Environmental newsletters |
6% |
|
Water and sanitation newsletters |
6% |
|
Forestry newsletters |
5% |
|
Medical journals |
4% |
|
Food technology |
3% |
|
Total |
100% |
5.5.5 Use of information from Footsteps
86% of respondents indicated that they had used information from Footsteps articles, of which over half had used three or more different ideas and nearly a fifth too many to mention. Of these, 54% provided clear evidence of the uptake of this information and a further 22% felt it likely that some people had implemented the new ideas but were unsure of the evidence to prove this. More research would be needed to investigate how often further supplementary information from other sources was also available to respondents. However, these findings indicate a readiness to implement new ideas from a printed source in isolation from other sources of information.
The final part of the postal survey looked only at those groups who were involved in production of printed materials and was completed by 60% of respondents. The results of this are given in Section 7 which looks at the production of locally generated training materials (page 55).
![]()
![]()
![]()