SPREADSHEETS TUTORIAL
CREATING A CHART
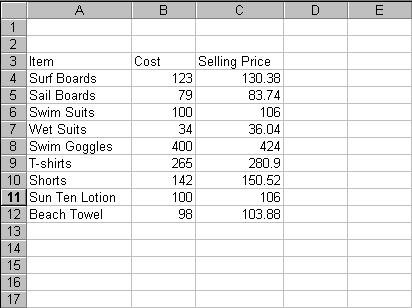
Open the BLANK document and copy the worksheet shown
below:

Highlight the text that is going to be represented in the
chart as shown below:

Chart Wizard
Select Chart from the Insert menu.

The Chart Wizard window is opened. The following menu options
are available to select different types of charts for display
and printing. The data that was selected to create the chart
will automatically be converted into the selected chart format.
A dialogue box is shown below:

The Standard Chart types present many options that can be
selected by highlighting the desired one. The graphic shows
the column chart type with a Clustered Column, used to compare
values across categories. You can click "Press and Hold
to View Sample" button to view a sample of the chart likely
to be created. And then press Next > button.

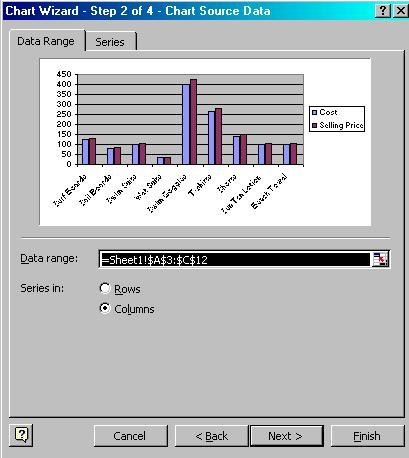
In the next dialogue box, specify where the Series are in
Rows or Columns. In the example, the Series are in Columns.
After press the Next > button.

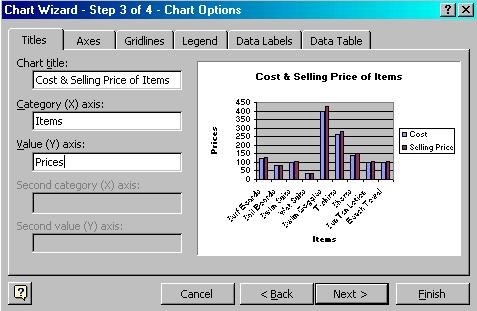
Type the Chart Title, Category for X-axis, and Value for
Y-axis and then Press the Next > button. Notice that
a sample is shown even as you type the Title, Category and
Value.

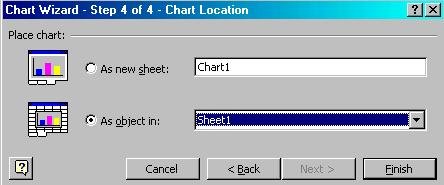
Specify where the Chart should be inserted in a new sheet
or the current Sheet and then Click Finish button.
Previous: Columns &
rows
|
